 The
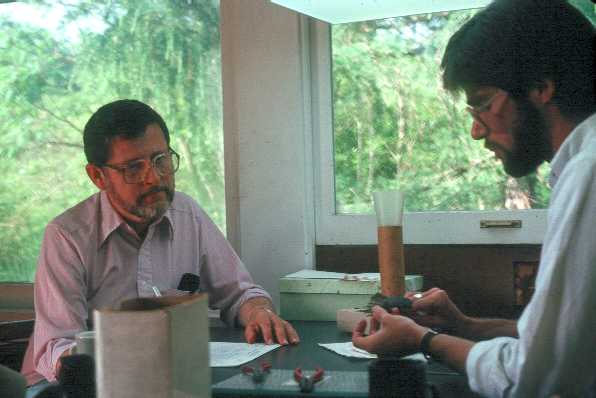
bird-banding program at Powdermill Biological Station, run by principal
bander Robert C.
Leberman (left), who began the program in 1961, and field ornithologist
Robert
S. Mulvihill (right), was in operation on 98 out of a possible 122
days during the fall period (August through November). Over 100 birds
were banded on 18 days during the season, with a peak of 186 on October
11. It is unusual for us not to tally >200 birds on at least one
day during the fall, but numbers of sparrows and finches were comparatively
very low during the last half of October, which is when we ordinarily catch
the greatest number of birds. Although our overall capture total
was average, our capture rate (i.e., birds per 100 net-hours) was well
below average. With 109 species and two recognizable forms banded,
however, the diversity of our catch this fall was above average.
As usual, a comparatively small number of species make up a large proportion
of our total catch--this season's "top
ten" list of most commonly banded birds was very similar to previous
years.
The
bird-banding program at Powdermill Biological Station, run by principal
bander Robert C.
Leberman (left), who began the program in 1961, and field ornithologist
Robert
S. Mulvihill (right), was in operation on 98 out of a possible 122
days during the fall period (August through November). Over 100 birds
were banded on 18 days during the season, with a peak of 186 on October
11. It is unusual for us not to tally >200 birds on at least one
day during the fall, but numbers of sparrows and finches were comparatively
very low during the last half of October, which is when we ordinarily catch
the greatest number of birds. Although our overall capture total
was average, our capture rate (i.e., birds per 100 net-hours) was well
below average. With 109 species and two recognizable forms banded,
however, the diversity of our catch this fall was above average.
As usual, a comparatively small number of species make up a large proportion
of our total catch--this season's "top
ten" list of most commonly banded birds was very similar to previous
years.
Highlight of the season was our first ever Sharp-tailed Sparrow. Captures of Sharp-shinned Hawk, Winter Wren, Black-throated Green Warbler, Magnolia Warbler, and Wood Thrush tied or broke long-standing records. Conspicuous "misses" included Red-breasted Nuthatch, Great Crested Flycatcher, Olive-sided Flycatcher, Worm-eating Warbler, Yellow-breasted Chat, Baltimore Oriole, Evening Grosbeak, and House Sparrow.
Our program could not be so productive without
the help of a great many people. This year, we were very ably assisted
on most days by our seasonal banding assistant, Laura
Quattrini, and on many occasions also by research
assistant Jim Sheehan.
We were fortunate, as always, to have assistance from a number of dedicated
volunteers, especially Darlene Madarish,
Carole
Shanahan, and Carroll
Labarthe. Others who assisted from time
to time included Jack
and Karyl Merchant
and their daughter Jessica,
Bob
Shaw, Peggy Wisner,
and Geoff Burtner.
For facilitating our efforts in many ways we thank Powdermill's Director,
Dr.
Joseph F. Merritt, and the station's maintenance
crew, Gilbert
and Albert Lenhart
and Lloyd Moore.
Last, but not least, we owe a tremendous debt to our data entry operator
at Carnegie Museum's Section of Birds, Marilyn
Niedermeier, who painstakingly enters, checks
and double checks all of our banding records, and who is responsible for
generating banding schedules and fulfilling data requests.
Below, and on the following pages (go to
species
total summaries), Powdermill banding totals (original captures only)
from fall 2000 are compared to averages and maxima for the previous 39
years, as well as, separately, to each of the four decades that the banding
program has been in operation. To some degree, trends may be apparent,
and these may be related to many ecological factors: habitat changes
in the banding area (e.g., rapid succession of surrounding old field habitats
after the late 60s; see graphs for Field
Sparrow, Yellow-breasted Chat,
and Brown Thrasher), weather related
events (e.g., mortality following extremely cold winters of 1977-78; see
Golden-crowned
Kinglet , Hermit Thrush and
Winter
Wren), breeding range expansions (see White-eyed
Vireo,
House Finch), irruptive
migrations (see Black-capped Chickadee,
Evening
Grosbeak,
Pine Siskin); pest
insect outbreaks (i.e., many boreal species--see Tennessee
Warbler, Bay-breasted Warbler,
Cape
May Warbler, and Swainson Thrush--may
have peaked in the early 70s and/or again in the early to mid-80s due extensive
spruce budworm outbreaks in Canada; see also Red-eyed
Vireo, which may show a response to the first gypsy moth invasion in
southwestern Pennsylvania from the late 80s to 1990). Finally, many
species, including a number of Neotropical migrants, show apparent long
-term increases (see Black-throated
Blue Warbler,
Chestnut-sided Warbler,
Magnolia
Warbler,
Hooded Warbler, American
Redstart) and or declines (see Eastern
Wood Pewee, Least Flycatcher,
and
Gray-cheeked Thrush) in fall
banding totals which, although intriguing, should be cautiously interepreted.
Except in the summary table below,
only raw data (i.e., uncorrected for effort) are being compared--importantly,
all of these data should be considered provisional.
They are presented here for
general interest, not as scientific analyses.
| Year(s) | 2000 | 1961-1999 | 1990-1999 | 1981-1990 | 1971-1980 |
|
|||||||||||
| Statistics | total | ave | max | ave | max | ave | max | ave | max | ave | max | ||||||
|
No. of birds |
6,178 | 6,069 | 10,129* | 6,308 | 9,641 | 7,232 | 10,129 | 5,914 | 7,203 | 4,729 | 6,476 | ||||||
| No. of species | 109 | 104 | 115 | 106 | 115 | 106 | 113 | 102 | 108 | 101 | 110 | ||||||
| No. of net-hours | 17,910 | 14,285 | 21,645 | 14,983 | 18,160 | 13,519 | 17,210 | 14,410 | 21,645 | 15,382 | 23,155 | ||||||
| No. birds/100 net-hrs. | 34 | 47 | 67 | 42 | 53 | 54 | 67 | 43 | 60 | 31 | 67 | ||||||
* maximum totals are underlined within all tables (i.e., these
are not links)
Go to Species Total Summaries:
Waterbirds through Woodpeckers
HOME
Last Updated on 12/13/00
By Robert S. Mulvihill